Gaffer 0.58.0: Render Logs
Before now, render output always went to the terminal that launched Gaffer. 0.58 brings the render log into the main UI. Read more to see how this works.
TL;DR
- Render log output is now available via the
InteractiveRenderNodecontrolling the render. Open itsNode Editorto see it. - The Viewer Render Control will show Warning/Error message counts. Click to open the log in a floating window, focused on the first warning/error.
- Lots of keyboard shortcuts, see below.
Overview
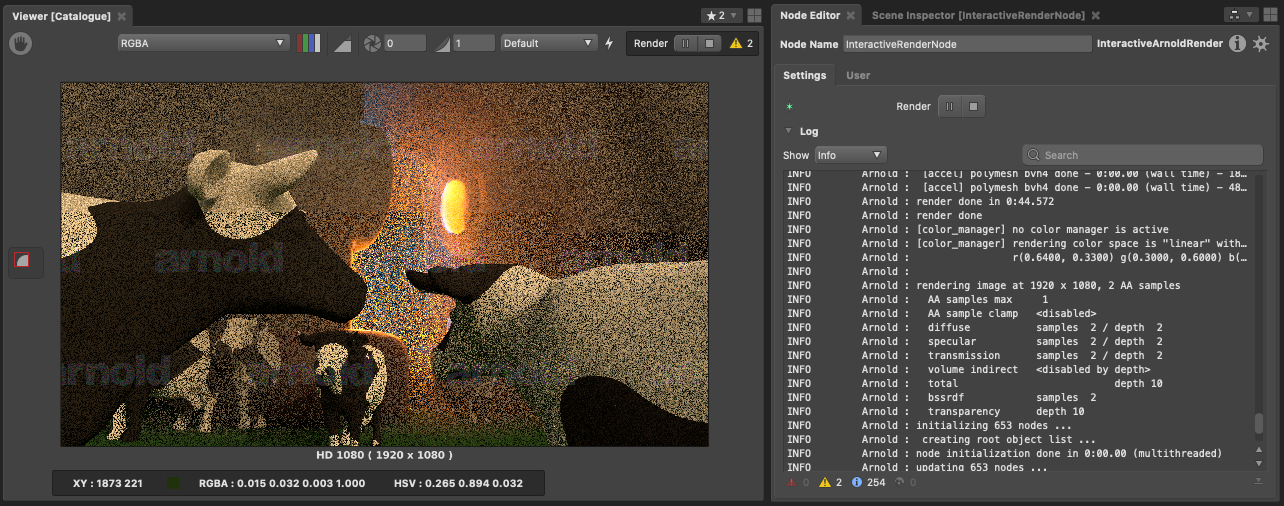
The new Log section in the `InteractiveRenderNode` UI shows real-time log output from the node's last render, render output will no longer go to the shell.
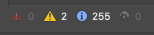
The number of messages of each severity is shown at the bottom of the widget. Clicking on the badge for particular severity jumps you to the next message of that kind. The e, w, i, d keys have the same effect. Hold <shift> to jump to the previous message instead.
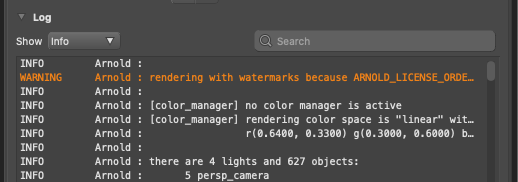
Log level filtering
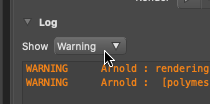
The Show popup menu determines the minimum severity that will be displayed in the log.
Search
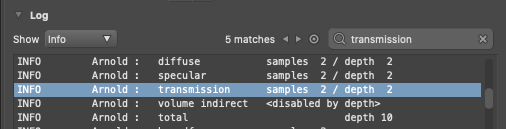
The search field allows you to jump to the next message that contains the search text you enter. The number of matches is shown to the left, and results can be navigated by pressing the enter key whilst the search box has focus, or the n or p keys whilst the log has focus.
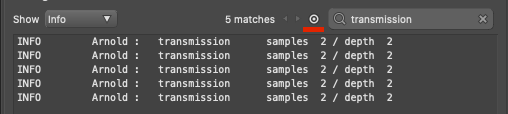
Clicking the Search focus button (

) will filter the log display to only show the lines that match your search string.
Viewer integration
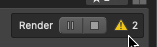
The Viewer Render Control widget now shows you the count of warning and error messages in the current render. Pressing one of these counts will open up the render log in a floating window.
